Data Analysis — CSIR NET Physics PYQ (Question 1)
A Data Analysis previous year question (PYQ) from General Aptitude (CSIR NET physics). Read the question, check the correct answer, then practise the full topic.
Question 1 of 25
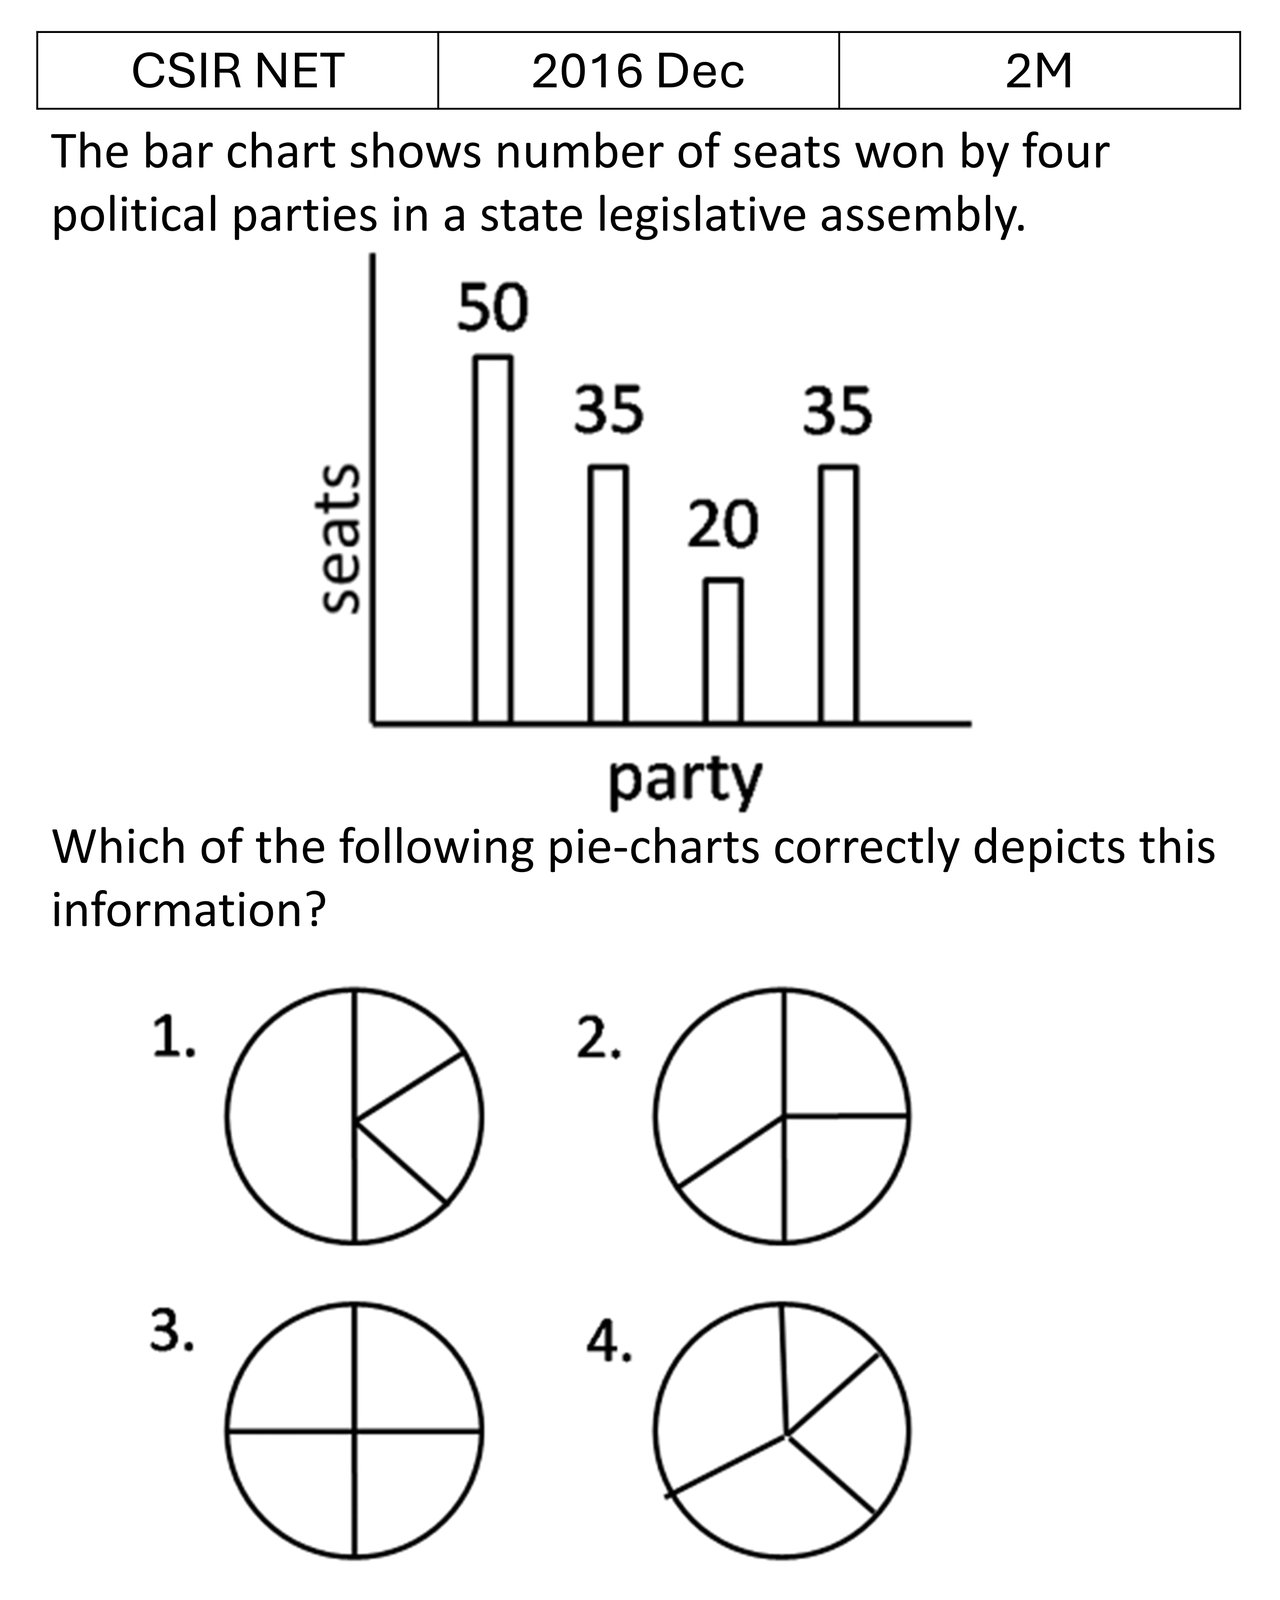
Correct answer: Option 2
Practise all 25 Data Analysis questions with instant feedback.
Practise this topic →About this question
This Data Analysis PYQ is part of the General Aptitude section of CSIR NET physics. Browse more Data Analysis questions or join the PhysicsByAaryan live batch for full conceptual coverage.